> ## Documentation Index
> Fetch the complete documentation index at: https://dragonwingdocs.qualcomm.com/llms.txt
> Use this file to discover all available pages before exploring further.
# Profile your AI model using QAIRT SDK
> Profile AI model performance on Qualcomm Dragonwing IoT platforms using QNN tools including qnn-net-run, qnn-throughput-net-run, and qnn-profile-viewer.
Profile your AI model using QAIRT SDK to measure the total runtime of model execution on a specified backend and optimize performance. Profiling provides detailed insights into latency and hardware utilization during execution.
Enable additional profiling options to view execution times at different levels, such as per operation or per layer. Use this profiling information to identify bottlenecks and inefficiencies in graph execution, so you can optimize QNN runtime and reduce model latency.
## Prerequisites
* Set up the QAIRT SDK on your host computer.
For detailed installation and configuration instructions, see [Set up Qualcomm AI Runtime SDK](../topic/qairt-setup).
* Select the model for profiling.
You can either convert and quantize a custom model using QAIRT tools or generate a quantized
model through AI Hub. For detailed guidance on compiling and optimizing models, see
[Compile and optimize an AI model](../map/compile-and-optimize-model).
The following instructions use the Inception V3 model from AI Hub.
* Enable Wi-Fi and SSH on the device.
The device requires an internet connection to download the artifacts needed to run sample applications. If SSH and Wi-Fi are already configured, skip this step.
Follow [Setup an SSH connection](https://dragonwingdocs.qualcomm.com/Technologies/Ethernet/get-started-with-ethernet#set-up-an-ssh-connection) to enable Wi-Fi and SSH on the device.
* Ensure that you have installed the following QNN tools on the target device as part of the build.
* qnn-net-run
* qnn-throughput-net-run
* qnn-context-binary-generator
* qnn-profile-viewer
## Profiling levels on HTP
The following table provides the profiling levels, their description, and configuration:
| Profiling levels | Description | Configuration |
| ---------------- | -------------------------------------------------------------------------------------------------------------------------------------------------------------------------------- | -------------------------------------------------------------------------------------------------------------------------- |
| Basic | • Total model execution time in microseconds
• Use for latency measurements | `--profiling_level=basic` with `qnn-net-run` |
| Detailed | Provides basic information along with the per-operation execution time in cycles. | `--profiling_level=detailed` with `qnn-net-run` |
| Lint | • Provides per-op cycle count on main thread and background execution information.
• Enables chrometrace for deeper analysis. | `--profiling_level=backend` with `qnn-net-run` and `--profiling_level=linting` inside `backend_extension_config.json` file |
| Opttrace | • Provides extremely detailed operation-level HTP execution status.
• Provides HVX/HMX utilization and VTCM usage.
• Use for in-depth performance bottleneck analysis. | `--profiling_level=detailed` and `--profiling_options=optrace` with `qnn-net-run` |
The following figure shows the primary execution profiling events for HTP and how these events are measured during inference:
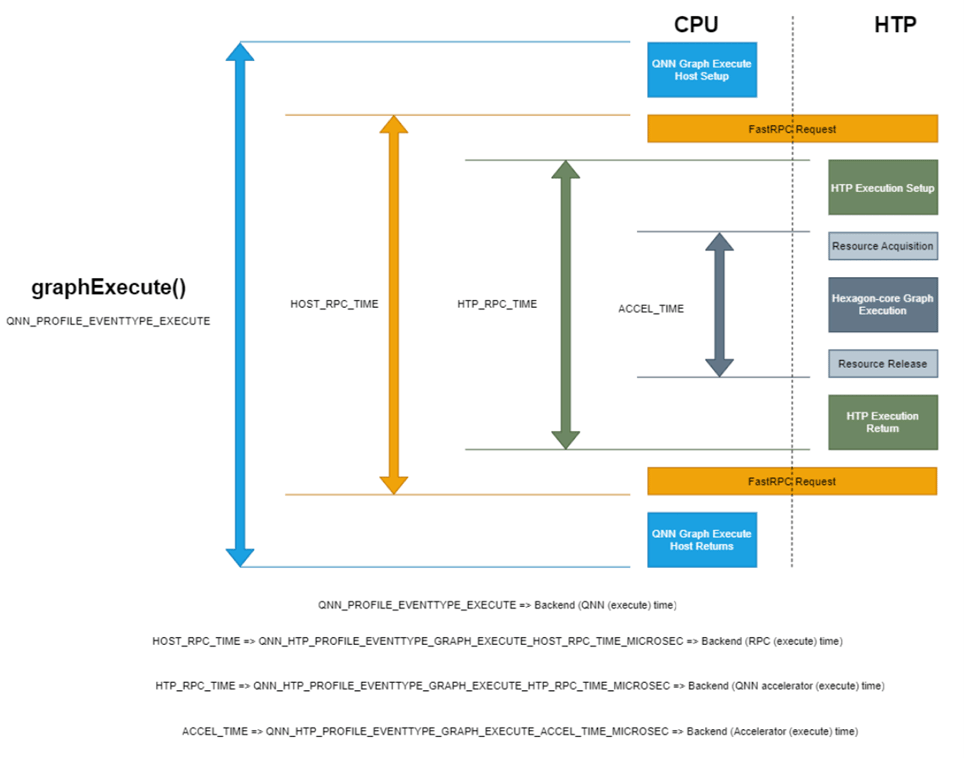 **Figure: HTP basic profiling events**
## Perform Lint profile with `qnn-net-run`
Lint profiling provides detailed per-operation cycle counts on the main thread along with background execution information. The following steps perform lint profiling on the Inception-v3 AI Hub model. Follow these steps and replace the model with your custom model.
```shell theme={null}
ssh ubuntu@
```
When prompted, enter the password.
```shell theme={null}
curl -L https://huggingface.co/qualcomm/Inception-v3/resolve/v0.42.0/Inception-v3_w8a8.dlc -o /etc/models/inception_v3_quantized.dlc
```
For demonstration purposes, you can profile the model using generated input files.
Generate these input files using the following Python script tailored for the `inception_v3_quantized.dlc` model.
```python theme={null}
import os
import numpy as np
input_path_list =[]
BASE_PATH = "/tmp/RandomInputsForInceptionV3Profiling/"
if not os.path.exists(BASE_PATH):
os.mkdir(BASE_PATH)
# generate 10 random inputs and save as raw
NUM_IMAGES = 10
#binary files
for img in range(NUM_IMAGES):
filename = "input_{}.raw".format(img)
randomTensor = np.random.random((1, 224, 224, 3)).astype(np.float32)
filename = os.path.join(BASE_PATH, filename)
randomTensor.tofile(filename)
input_path_list.append(filename)
#for saving as input_list text
with open("input_list_profiling.txt", "w") as f:
for path in input_path_list:
f.write(path)
f.write("\n")
```
This script generates 10 sample input files saved in the `/tmp/RandomInputsForInceptionV3Profiling/`
directory and an `input_list_profiling.txt` file that contains the path to each sample generated.
```shell theme={null}
python3 /etc/models/generate_random_input.py
```
Create the `backend_extension_config_file.json` and `htp_config.json` files in the `/etc/models` directory
of the target device to profile the model using the HTP runtime.
* `backend_extension_config_file.json`
```json theme={null}
{
"backend_extensions": {
"shared_library_path" : "libQnnHtpNetRunExtensions.so",
"config_file_path" : "./htp_config.json"
}
}
```
* `htp_config.json`
```json theme={null}
{
"graphs": [
{
"vtcm_mb": 2,
"fp16_relaxed_precision": 0,
"graph_names": [
"graph_name_1"
],
"O": 3.0
}
],
"devices": [
{
"dsp_arch": "v68",
"profiling_level": "linting",
"cores": [
{
"perf_profile": "burst"
}
]
}
]
}
```
* Use `"dsp_arch": "v68"` for Qualcomm Dragonwing™ RB3 Gen 2
* Use `"dsp_arch": "v75"` for Dragonwing IQ-8275
* Use `"dsp_arch": "v73"` for Dragonwing IQ-9075
```shell theme={null}
qnn-net-run --model libQnnModelDlc.so \
--backend libQnnHtp.so \
--input_list input_list_profiling.txt \
--config_file backend_extension_config_file.json \
--output_dir output_htp \
--profiling_level backend \
--dlc_path /etc/models/inception_v3_quantized.dlc
```
This step ensures that the profiling level defined in the backend-specific configuration file is applied.
The `execution_metadata.yaml` and `qnn-profiling-data_0.log` files should be created in the `/etc/models/output_htp` directory.
To view logs from the qnn-profiling-data\_0.log file, use qnn-profile-viewer.
**Figure: HTP basic profiling events**
## Perform Lint profile with `qnn-net-run`
Lint profiling provides detailed per-operation cycle counts on the main thread along with background execution information. The following steps perform lint profiling on the Inception-v3 AI Hub model. Follow these steps and replace the model with your custom model.
```shell theme={null}
ssh ubuntu@
```
When prompted, enter the password.
```shell theme={null}
curl -L https://huggingface.co/qualcomm/Inception-v3/resolve/v0.42.0/Inception-v3_w8a8.dlc -o /etc/models/inception_v3_quantized.dlc
```
For demonstration purposes, you can profile the model using generated input files.
Generate these input files using the following Python script tailored for the `inception_v3_quantized.dlc` model.
```python theme={null}
import os
import numpy as np
input_path_list =[]
BASE_PATH = "/tmp/RandomInputsForInceptionV3Profiling/"
if not os.path.exists(BASE_PATH):
os.mkdir(BASE_PATH)
# generate 10 random inputs and save as raw
NUM_IMAGES = 10
#binary files
for img in range(NUM_IMAGES):
filename = "input_{}.raw".format(img)
randomTensor = np.random.random((1, 224, 224, 3)).astype(np.float32)
filename = os.path.join(BASE_PATH, filename)
randomTensor.tofile(filename)
input_path_list.append(filename)
#for saving as input_list text
with open("input_list_profiling.txt", "w") as f:
for path in input_path_list:
f.write(path)
f.write("\n")
```
This script generates 10 sample input files saved in the `/tmp/RandomInputsForInceptionV3Profiling/`
directory and an `input_list_profiling.txt` file that contains the path to each sample generated.
```shell theme={null}
python3 /etc/models/generate_random_input.py
```
Create the `backend_extension_config_file.json` and `htp_config.json` files in the `/etc/models` directory
of the target device to profile the model using the HTP runtime.
* `backend_extension_config_file.json`
```json theme={null}
{
"backend_extensions": {
"shared_library_path" : "libQnnHtpNetRunExtensions.so",
"config_file_path" : "./htp_config.json"
}
}
```
* `htp_config.json`
```json theme={null}
{
"graphs": [
{
"vtcm_mb": 2,
"fp16_relaxed_precision": 0,
"graph_names": [
"graph_name_1"
],
"O": 3.0
}
],
"devices": [
{
"dsp_arch": "v68",
"profiling_level": "linting",
"cores": [
{
"perf_profile": "burst"
}
]
}
]
}
```
* Use `"dsp_arch": "v68"` for Qualcomm Dragonwing™ RB3 Gen 2
* Use `"dsp_arch": "v75"` for Dragonwing IQ-8275
* Use `"dsp_arch": "v73"` for Dragonwing IQ-9075
```shell theme={null}
qnn-net-run --model libQnnModelDlc.so \
--backend libQnnHtp.so \
--input_list input_list_profiling.txt \
--config_file backend_extension_config_file.json \
--output_dir output_htp \
--profiling_level backend \
--dlc_path /etc/models/inception_v3_quantized.dlc
```
This step ensures that the profiling level defined in the backend-specific configuration file is applied.
The `execution_metadata.yaml` and `qnn-profiling-data_0.log` files should be created in the `/etc/models/output_htp` directory.
To view logs from the qnn-profiling-data\_0.log file, use qnn-profile-viewer.
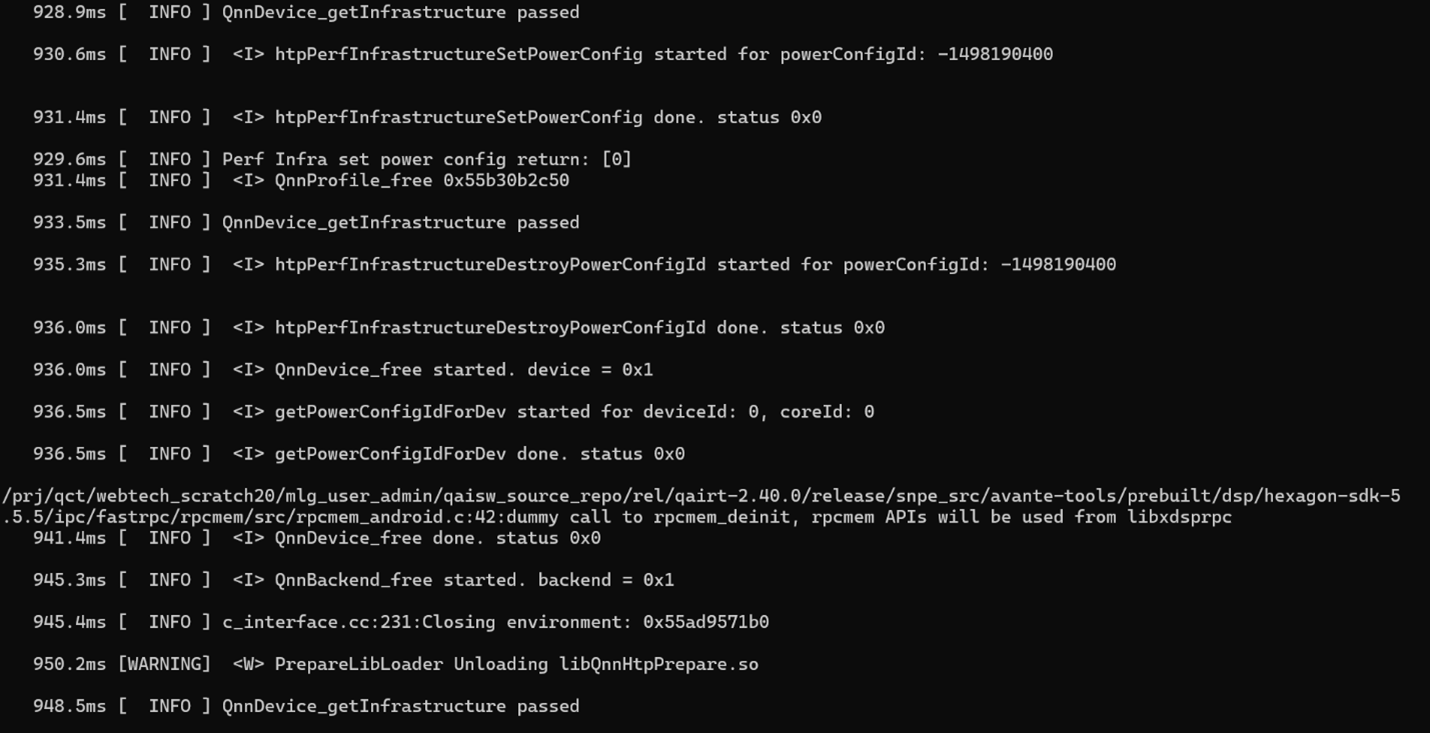 ## View lint profiling logs using qnn-profile-viewer
View the profile outputs generated at the backend profiling level by using the qnn-profile-viewer tool with the following plugins:
To retrieve linting information from an inference, run qnn-profile-viewer with the `libQnnHtpProfilingReader.so` plugin. This plugin provides raw output of every single run.
```shell theme={null}
qnn-profile-viewer --reader libQnnHtpProfilingReader.so --input_log /etc/models/output_htp/qnn-profiling-data_0.log --output /etc/models/output_htp/profile_htp.csv
```
The following is the sample output:
## View lint profiling logs using qnn-profile-viewer
View the profile outputs generated at the backend profiling level by using the qnn-profile-viewer tool with the following plugins:
To retrieve linting information from an inference, run qnn-profile-viewer with the `libQnnHtpProfilingReader.so` plugin. This plugin provides raw output of every single run.
```shell theme={null}
qnn-profile-viewer --reader libQnnHtpProfilingReader.so --input_log /etc/models/output_htp/qnn-profiling-data_0.log --output /etc/models/output_htp/profile_htp.csv
```
The following is the sample output:
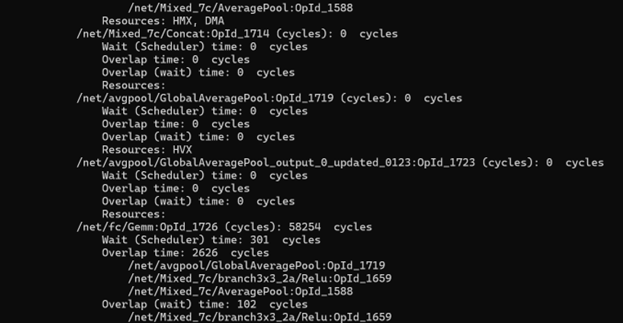 **Figure: Sample output of Lint profiling with libQnnHtpProfilingReader.so**
In the linting profiling report, each operation has:
* **Cycle count**: the time spent executing on the main thread.
* **Wait entry**: the cycles spent waiting before execution starts.
* **Overlap**: the cycles spent on at least one background operation while the main thread executes the current operation.
* **Overlap (wait)**: the cycles spent on at least one background operation during the main thread’s wait period.
Every operation on the main thread has a wait period before its executed, which only begins once the previous operation has ended. This delay may be caused by scheduling issues or by waiting for background activities like HVX or DMA to finish.
The `libQnnChrometraceProfilingReader.so` plugin provides average output of all the runs.
Additionally, if an output file is specified with the `--output` option, generates a file
containing the profiling data in chrometrace format.
```
qnn-profile-viewer --reader libQnnChrometraceProfilingReader.so --input_log /etc/models/output_htp/qnn-profiling-data_0.log --output /etc/models/output_htp/chromeTrace.json
```
The following figures shows the sample output:
**Figure: Sample output of Lint profiling with libQnnHtpProfilingReader.so**
In the linting profiling report, each operation has:
* **Cycle count**: the time spent executing on the main thread.
* **Wait entry**: the cycles spent waiting before execution starts.
* **Overlap**: the cycles spent on at least one background operation while the main thread executes the current operation.
* **Overlap (wait)**: the cycles spent on at least one background operation during the main thread’s wait period.
Every operation on the main thread has a wait period before its executed, which only begins once the previous operation has ended. This delay may be caused by scheduling issues or by waiting for background activities like HVX or DMA to finish.
The `libQnnChrometraceProfilingReader.so` plugin provides average output of all the runs.
Additionally, if an output file is specified with the `--output` option, generates a file
containing the profiling data in chrometrace format.
```
qnn-profile-viewer --reader libQnnChrometraceProfilingReader.so --input_log /etc/models/output_htp/qnn-profiling-data_0.log --output /etc/models/output_htp/chromeTrace.json
```
The following figures shows the sample output:
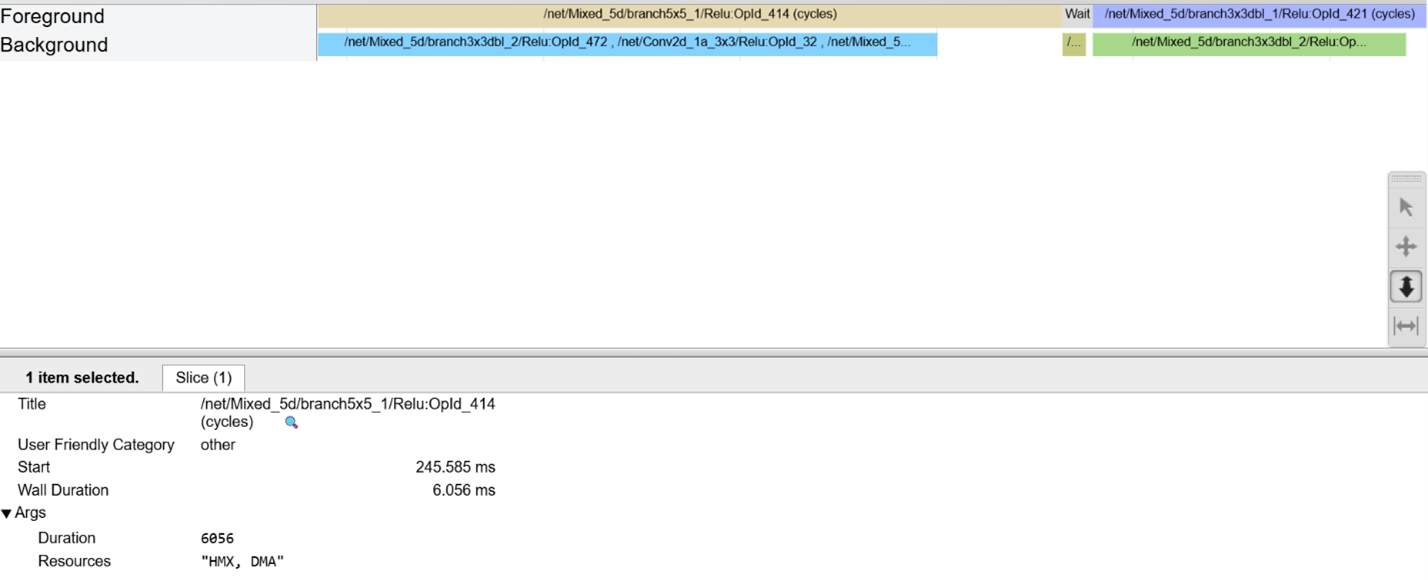 **Figure: Sample output of Lint profiling with libQnnChrometraceProfilingReader.so**
To view the chrome trace, use Google Chrome.
## Perform advanced profiling with QNN HTP Optrace
Use QNN optrace profiling to understand detailed internal operations of QNN HTP hardware blocks. This capability helps you:
* Identify problematic operations that may not be parallelized well.
* See how operations are scheduled throughout execution.
* Observe the interaction between various operators.
* Evaluate how efficiently HVX parallelism works for each operation.
To understand more about QNN HTP optrace profiling, see [QNN HTP Optrace Profiling](https://docs.qualcomm.com/nav/home/htp_backend.html?product=1601111740009302#qnn-htp-optrace-profiling).
## Perform profiling with `qnn-throughput-net-run`
Use qnn-throughput-net-run for multi-threaded execution across one or more QNN backends. This profiling supports multi-threaded execution and lets you run models repeatedly for a specified duration or a set number of iterations. Use this profiling for scenarios where you need concurrent or repeated execution of multiple models for performance benchmarking.
```shell theme={null}
ssh ubuntu@
```
When prompted, enter the password.
```shell theme={null}
mkdir -p /etc/models
```
```shell theme={null}
curl -L https://huggingface.co/qualcomm/Inception-v3/resolve/v0.42.0/Inception-v3_w8a8.dlc -o /etc/models/inception_v3_quantized.dlc
```
Create the files in the `/etc/models` directory.
These files are required to generate the context binary in the next step.
* **backend\_extension\_config.json**
```json theme={null}
{
"backend_extensions": {
"shared_library_path": "libQnnHtpNetRunExtensions.so",
"config_file_path": "./htp_config.json"
}
}
```
* **htp\_config.json**
```json theme={null}
{
"graphs": [
{
"vtcm_mb": 2,
"fp16_relaxed_precision": 0,
"graph_names": [
"graph_name_2"
],
"O": 3.0
}
],
"devices": [
{
"dsp_arch": "v68",
"profiling_level": "linting",
"cores": [
{
"perf_profile": "burst"
}
]
}
]
}
```
- Use `"dsp_arch": "v68"` for Qualcomm Dragonwing™ RB3 Gen 2.
- Use `"dsp_arch": "v75"` for Dragonwing IQ-8275.
- Use `"dsp_arch": "v73"` for Dragonwing IQ-9075.
```shell theme={null}
qnn-context-binary-generator --log_level=info --backend libQnnHtp.so --model libQnnModelDlc.so --config_file /etc/models/backend_extension_config.json --output_dir context_bin_dir --dlc_path /etc/models/inception_v3_quantized.dlc --binary_file inception_v3
```
The `qnn-throughput-net-run` command will ingest the generated context binary.
Create these files in the `/etc/models/` directory on the target device.
* `htp_backend.json`:
```json theme={null}
{
"devices": [
{
"dsp_arch": "v68",
"device_id" : 0
}
]
}
```
* `qtnr_config.json`:
```json theme={null}
{
"backends": [
{
"backendName": "htp_backend",
"backendPath": "libQnnHtp.so",
"profilingLevel": "BASIC",
"backendExtensions": "libQnnHtpNetRunExtensions.so",
"perfProfile": "burst"
}
],
"models": [
{
"modelName": "inception_v3",
"modelPath": "/etc/models/context_bin_dir/inception_v3.bin",
"loadFromCachedBinary": true,
"outputPath": "output_original"
}
],
"contexts": [
{
"contextName": "htp_context_1",
"priority": "HIGH"
}
],
"testCase": {
"iteration": 1,
"logLevel": "info",
"threads": [
{
"threadName": "htp_thread_1",
"backend": "htp_backend",
"context": "htp_context_1",
"model": "inception_v3",
"interval": 0,
"loopUnit": "second",
"loop": 10,
"backendConfig": "htp_backend.json"
}
]
}
}
```
- Use `"dsp_arch"`: `"v68"` for Qualcomm Dragonwing™ RB3 Gen 2
- Use `"dsp_arch"`: `"v75"` for Dragonwing IQ-8275
- Use `"dsp_arch"`: `"v73"` for Dragonwing IQ-9075
```shell theme={null}
cd /etc/models
```
```shell theme={null}
qnn-throughput-net-run --config /etc/models/qtnr_config.json --output /etc/models/output_qtnr.json
```
The profiling information is generated in the `/etc/models` directory.
**Figure: Sample output of Lint profiling with libQnnChrometraceProfilingReader.so**
To view the chrome trace, use Google Chrome.
## Perform advanced profiling with QNN HTP Optrace
Use QNN optrace profiling to understand detailed internal operations of QNN HTP hardware blocks. This capability helps you:
* Identify problematic operations that may not be parallelized well.
* See how operations are scheduled throughout execution.
* Observe the interaction between various operators.
* Evaluate how efficiently HVX parallelism works for each operation.
To understand more about QNN HTP optrace profiling, see [QNN HTP Optrace Profiling](https://docs.qualcomm.com/nav/home/htp_backend.html?product=1601111740009302#qnn-htp-optrace-profiling).
## Perform profiling with `qnn-throughput-net-run`
Use qnn-throughput-net-run for multi-threaded execution across one or more QNN backends. This profiling supports multi-threaded execution and lets you run models repeatedly for a specified duration or a set number of iterations. Use this profiling for scenarios where you need concurrent or repeated execution of multiple models for performance benchmarking.
```shell theme={null}
ssh ubuntu@
```
When prompted, enter the password.
```shell theme={null}
mkdir -p /etc/models
```
```shell theme={null}
curl -L https://huggingface.co/qualcomm/Inception-v3/resolve/v0.42.0/Inception-v3_w8a8.dlc -o /etc/models/inception_v3_quantized.dlc
```
Create the files in the `/etc/models` directory.
These files are required to generate the context binary in the next step.
* **backend\_extension\_config.json**
```json theme={null}
{
"backend_extensions": {
"shared_library_path": "libQnnHtpNetRunExtensions.so",
"config_file_path": "./htp_config.json"
}
}
```
* **htp\_config.json**
```json theme={null}
{
"graphs": [
{
"vtcm_mb": 2,
"fp16_relaxed_precision": 0,
"graph_names": [
"graph_name_2"
],
"O": 3.0
}
],
"devices": [
{
"dsp_arch": "v68",
"profiling_level": "linting",
"cores": [
{
"perf_profile": "burst"
}
]
}
]
}
```
- Use `"dsp_arch": "v68"` for Qualcomm Dragonwing™ RB3 Gen 2.
- Use `"dsp_arch": "v75"` for Dragonwing IQ-8275.
- Use `"dsp_arch": "v73"` for Dragonwing IQ-9075.
```shell theme={null}
qnn-context-binary-generator --log_level=info --backend libQnnHtp.so --model libQnnModelDlc.so --config_file /etc/models/backend_extension_config.json --output_dir context_bin_dir --dlc_path /etc/models/inception_v3_quantized.dlc --binary_file inception_v3
```
The `qnn-throughput-net-run` command will ingest the generated context binary.
Create these files in the `/etc/models/` directory on the target device.
* `htp_backend.json`:
```json theme={null}
{
"devices": [
{
"dsp_arch": "v68",
"device_id" : 0
}
]
}
```
* `qtnr_config.json`:
```json theme={null}
{
"backends": [
{
"backendName": "htp_backend",
"backendPath": "libQnnHtp.so",
"profilingLevel": "BASIC",
"backendExtensions": "libQnnHtpNetRunExtensions.so",
"perfProfile": "burst"
}
],
"models": [
{
"modelName": "inception_v3",
"modelPath": "/etc/models/context_bin_dir/inception_v3.bin",
"loadFromCachedBinary": true,
"outputPath": "output_original"
}
],
"contexts": [
{
"contextName": "htp_context_1",
"priority": "HIGH"
}
],
"testCase": {
"iteration": 1,
"logLevel": "info",
"threads": [
{
"threadName": "htp_thread_1",
"backend": "htp_backend",
"context": "htp_context_1",
"model": "inception_v3",
"interval": 0,
"loopUnit": "second",
"loop": 10,
"backendConfig": "htp_backend.json"
}
]
}
}
```
- Use `"dsp_arch"`: `"v68"` for Qualcomm Dragonwing™ RB3 Gen 2
- Use `"dsp_arch"`: `"v75"` for Dragonwing IQ-8275
- Use `"dsp_arch"`: `"v73"` for Dragonwing IQ-9075
```shell theme={null}
cd /etc/models
```
```shell theme={null}
qnn-throughput-net-run --config /etc/models/qtnr_config.json --output /etc/models/output_qtnr.json
```
The profiling information is generated in the `/etc/models` directory.
 **Figure: Sample output of qnn-throughput-net-run profiling**