> ## Documentation Index
> Fetch the complete documentation index at: https://dragonwingdocs.qualcomm.com/llms.txt
> Use this file to discover all available pages before exploring further.
# Collect and parse RAM dump
A RAM dump is a snapshot of the system memory at the time of device failure and is useful for debugging various crash issues.
## **Enable RAM dump**
By default, the `debug` build includes the RAM dump, but it's disabled in `perf` or `non-DEBUG` builds through a kernel command-line parameter. To configure the RAM dump, use the `qcom_scm.download_mode` parameter in the `meta-qcom/ci/base.yml` file as:
* 0: Disable
* 1: Enable
The following is the sample code snippet:
```text theme={null}
cmdline: |
KERNEL_CMDLINE_EXTRA:append = " qcom_scm.download_mode=1"
```
## **Collect RAM dump**
After the system crash, the device reboots into RAM dump mode and waits for RAM dump collection through USB in the bootloader. To collect the RAM dump over USB, use the Product Configuration Assistant Tool (PCAT). Download the PCAT tool from the [Qualcomm Software Center](https://softwarecenter.qualcomm.com/#/catalog/item/PCAT). After installing PCAT, access the PCAT user guide at the following locations:
* Windows host computer: `C:\Program Files(x86)\Qualcomm\PCAT\Docs`
* Linux host computer: `/opt/qcom/PCAT/Docs/`
To collect RAM dump using PCAT, do the following:
1. Start PCAT on a Windows host computer and connect the device, which is already in the RAM dump mode.
If necessary, to trigger a device crash, select **CRASH** on the PCAT interface.
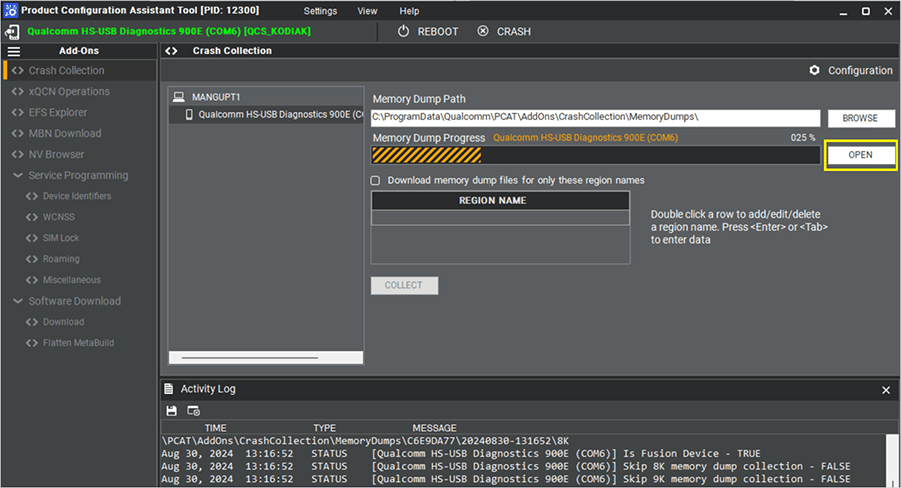
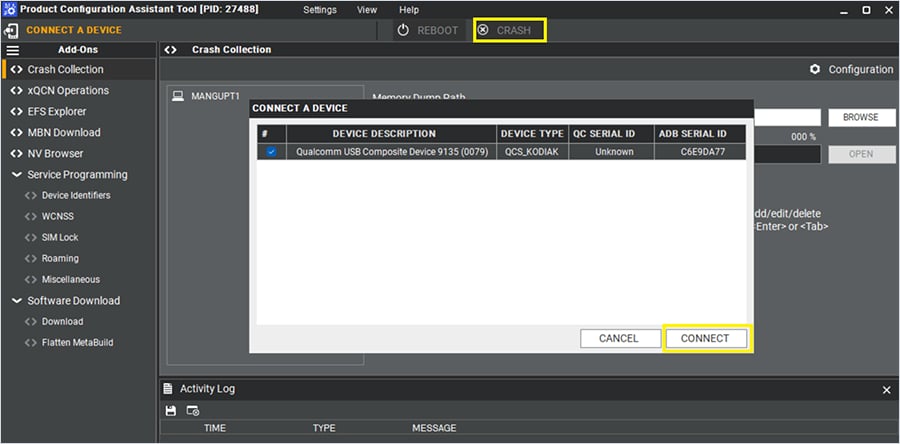 After you connect the device to the Windows host computer, PCAT automatically starts capturing the RAM dump, and the PCAT UI displays the progress of the dump collection.
2\. To view the dump, select **OPEN**.
After you connect the device to the Windows host computer, PCAT automatically starts capturing the RAM dump, and the PCAT UI displays the progress of the dump collection.
2\. To view the dump, select **OPEN**.
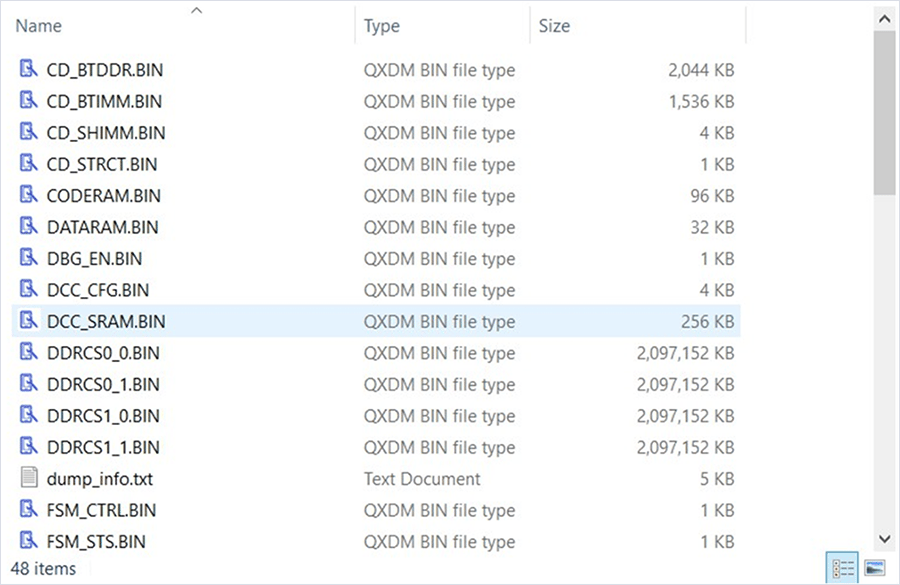
 The following example shows the contents of a RAM dump directory:
 The Linux host computer uses a command-line interface rather than a GUI for PCAT-based RAM dump capture, such as `PCAT -PLUGIN CC -DEVICE -DUMPDIR /tmp -RESET TRUE -UNIQUETS TRUE`.
## **Capture the subsystem dumps**
This feature is available to licensed developers with authorized access. For more information about how to enable and capture coredumps of subsystems, see [Qualcomm Linux Debug Guide - Addendum](https://docs.qualcomm.com/bundle/resource/topics/80-80021-12A/debugging_linux_kernel.html#subsystem_ram_dumps).
The Linux host computer uses a command-line interface rather than a GUI for PCAT-based RAM dump capture, such as `PCAT -PLUGIN CC -DEVICE -DUMPDIR /tmp -RESET TRUE -UNIQUETS TRUE`.
## **Capture the subsystem dumps**
This feature is available to licensed developers with authorized access. For more information about how to enable and capture coredumps of subsystems, see [Qualcomm Linux Debug Guide - Addendum](https://docs.qualcomm.com/bundle/resource/topics/80-80021-12A/debugging_linux_kernel.html#subsystem_ram_dumps).