

Basic troubleshooting
Basic troubleshooting involves fundamental techniques at the application level. It’s useful when developing applications using the Qualcomm development kits for educational and academic purposes. Basic troubleshooting can be applied to devices with Qualcomm® Linux® that operate without requiring root access. For more complex issues, see Advanced troubleshooting.Analyze user space and kernel traces
Tools such as Function tracer (ftrace), Trace Compass, and LTTng are commonly used to analyze traces on Linux for performance issues.| Performance debug tool | Reference |
|---|---|
| Trace Compass | Trace Compass User Guide |
| LTTng | LTTng Documentation |
-llttng-ust and -g -finstrument-functions to display the function call stack.
For example, run the following command for compilation:
aarch64-qcom-linux-gccaarch64-qcom-linux-g++
Capture LTTng-UST trace
To capture a trace using LTTng, follow these steps:- To display a call stack of the application with
liblttng-ust-cyg-profile.socreate a session named my-session with the following command:The traces are available at/tmp/my-trace. - Run the commands in the following sequence to capture the traces:
- Preload the
liblttng-ust-cyg-profilelibrary when running your program:
Load LTTng traces
- To load and visualize the LTTng traces in Trace Compass, use secure copy protocol (SCP) or a similar tool to transfer a trace from the target to the host. Ensure that you specify the target IP address in the command. Here is an example command:
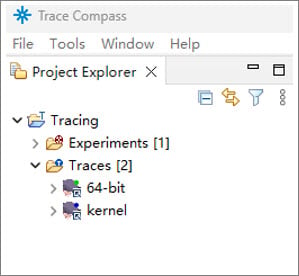
- Load the LTTng kernel and UST traces with Trace Compass on the host machine. From the Trace Compass tool, use the File menu option to open a trace. Note The screenshots are provided for reference. The directory structure shown in the screenshots may vary depending on the Trace Compass tool version.
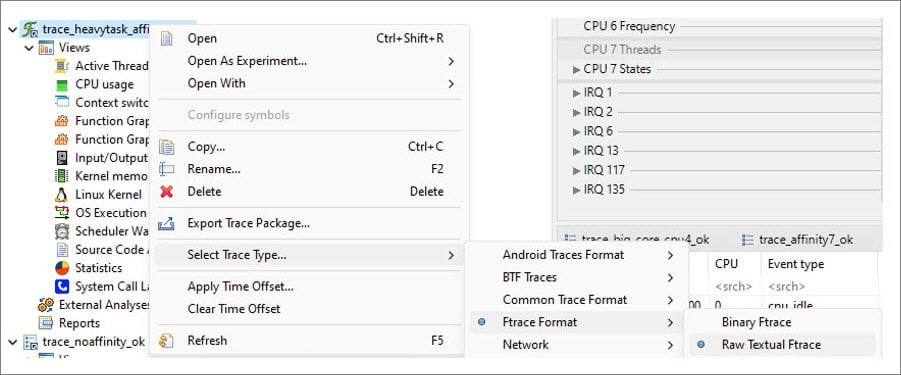
- To select a trace type, right-click on the trace, and choose Select Trace Type > Ftrace Format > Raw Textual Ftrace as shown in the following figure:
- Install the required add-ons in Trace Compass for ftrace analysis. Go to Menu > Tools > Add-ons, and select Trace Compass ftrace. Note It’s recommended to update the Trace Compass preferences. To print the time that matches the raw ftrace, change Tracing–Time Format to TTT (seconds in epoch).
- To display the kernel and UST traces in one view, create Experiments and add two traces.
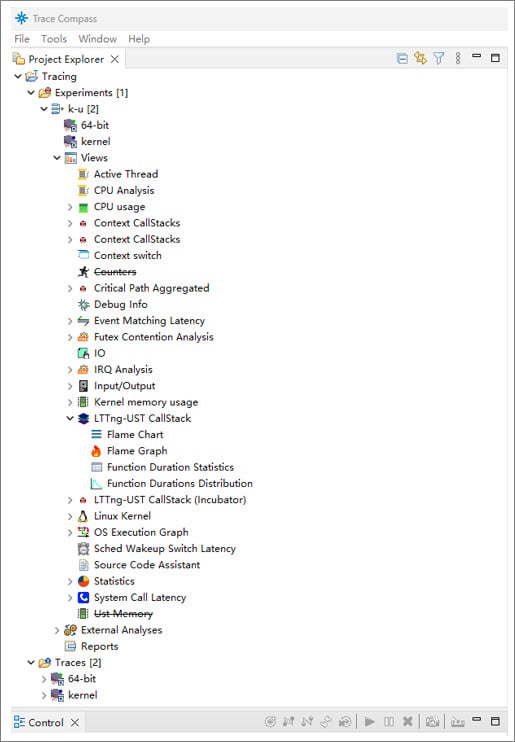
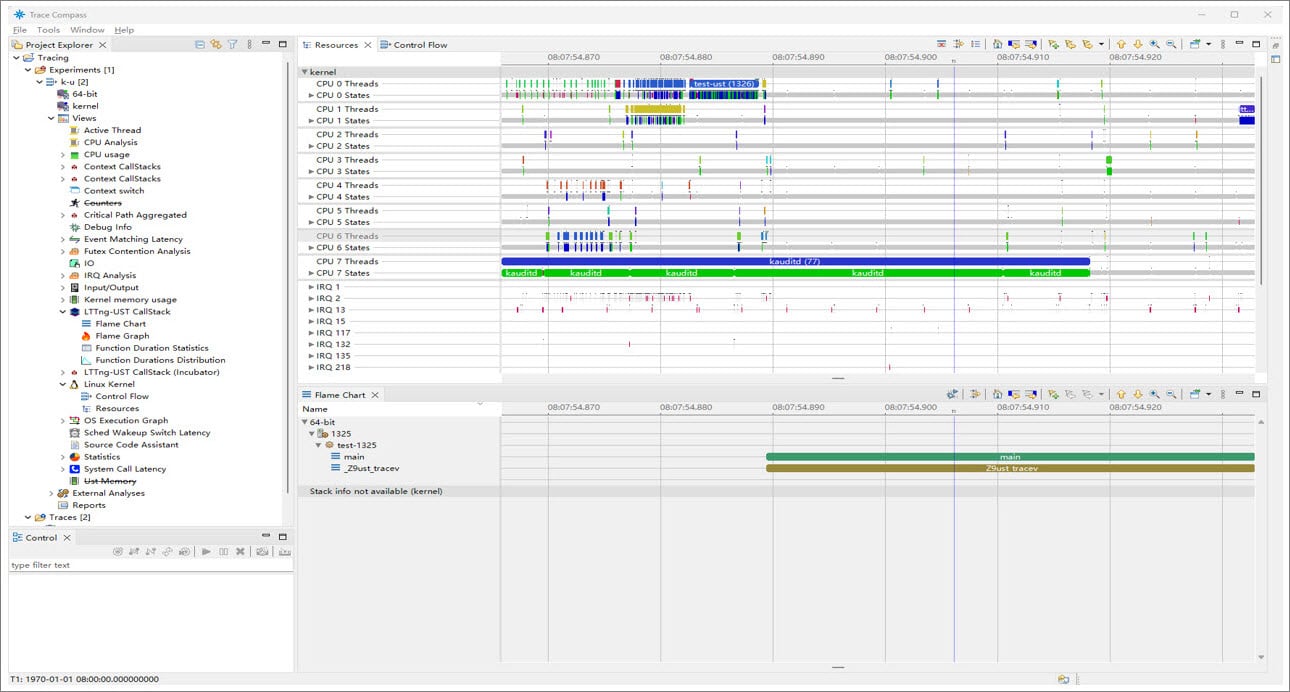
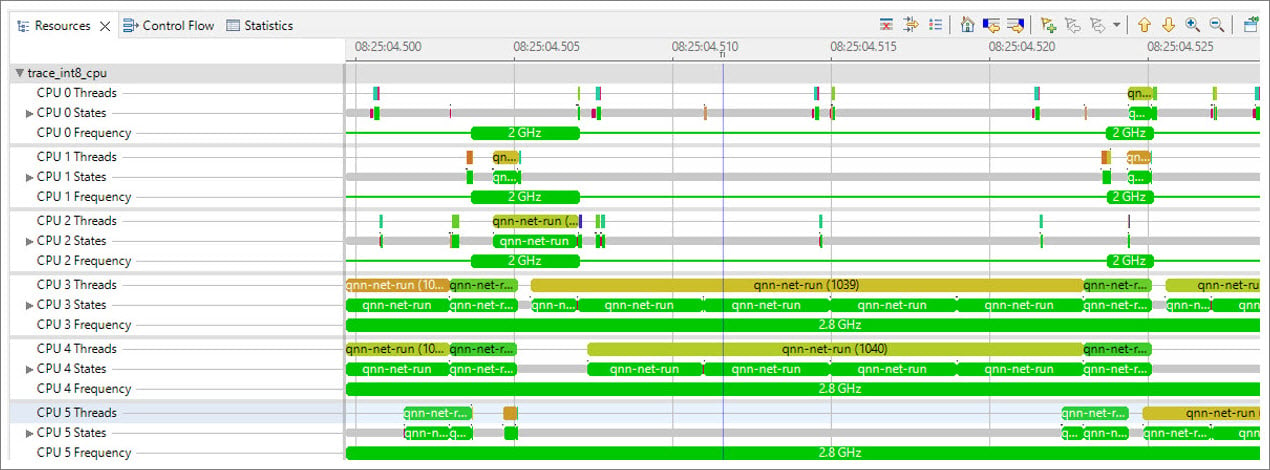
- Select Views > LTTng-UST-CallStack > Flame Chart and Views > Linux Kernel > Resources. Trace Compass can display kernel resources and user space application function call stack as shown in the following figure:
- Follow step 6 to open a trace for the CPU frequency. Select the Resources panel and the Timeline view of the process running on a specified CPU. There is a frequency number in the CPU frequency line. The following figure shows CPU0 to CPU2 running at 2 GHz and CPU3 to CPU5 running at 2.8 GHz.
Monitor CPU consumption of user space application
Several Linux utilities, such as top and htop can be used to monitor the CPU usage.Top
Top is a tool that checks the CPU usage for an application and displays the overall CPU usage. On an octa‑core platform, tasks can consume the CPU from 0% to 800%. To set a terminal environment to run top, run the following commands on the device: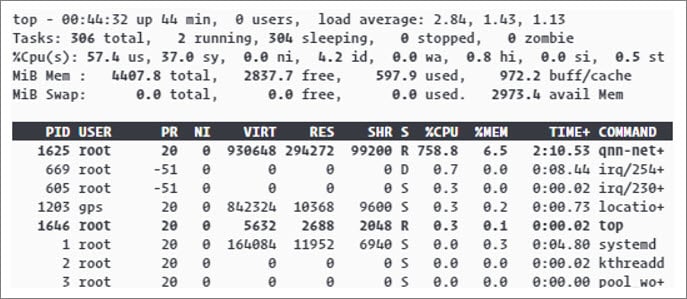
htop
htop displays the per-core CPU usage and overall CPU usage for each process. To compile htop on a build, see Compile performance tools. To set a terminal environment for htop, run the following commands on the device: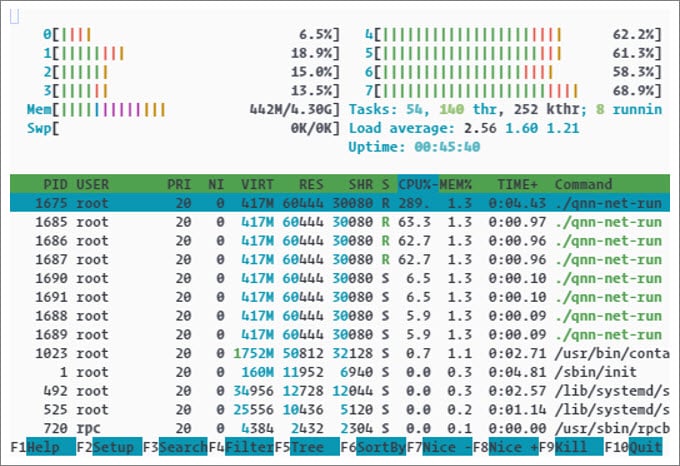
CPU usage in Trace Compass
- Open the Trace Compass tool on the host computer and load a trace.
- Right-click on the trace, and choose Select Trace Type > Ftrace Format Type > Raw Textual Ftrace as shown in the following figure:
- Right-click on Raw Textual Ftrace and select Open.
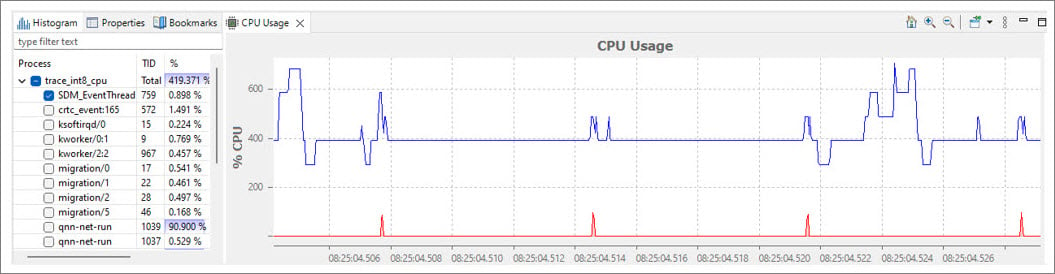
- Double-click on CPU usage to view the system-wide CPU usage. Select a task in the left panel to check the CPU usage per task as shown in the following figure:
Monitor the memory consumption of user space application
You can check the memory allocation and memory usage for various processes. To check memory consumption of a process, run the following command on a device: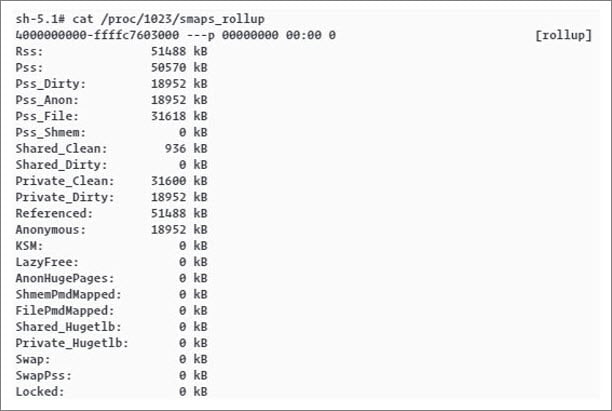
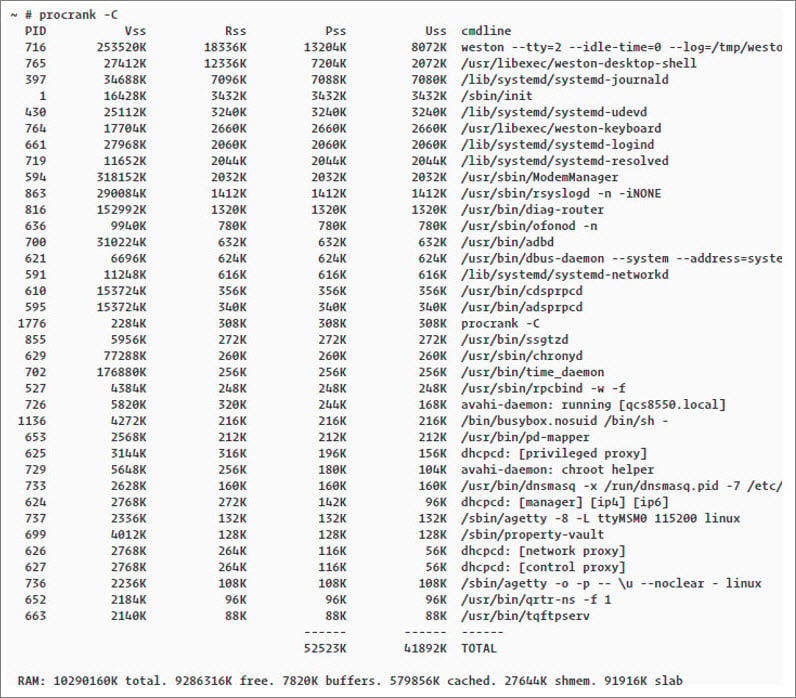
Procrank
Procrank is a tool that displays memory consumption for each process. By default, it shows the following set sizes:- VSS: Virtual set size
- RSS: Resident set size
- PSS: Proportional set size
- USS: Unique set size
Build Procrank from source code
Run the following commands on the host computer:- Boot the device.
- Log in to the serial shell.
- Run the following command:
- To start ADB, use one of the following options:
- Option 1: Reboot the device.
- Option 2: Run the following command:
/etc/usb-debugging-enabled file is removed and the device is rebooted.
Use Android Debug Bridge (adb) or a similar tool to transfer the Procrank file into the device from the host. Here are the example commands:
Ensure that you specify the target IP address in the command.
- To view the anonymous memory allocated by each process, run the following command on the device:
- To show the file cache memory allocated by each process, run the following command on the device:
- To view both the anonymous and file cache memories allocated by each process, run the following command on the device:
procrank -C command:
Check instructions per cycle of the application
The perf utility calculates instructions per cycle (IPC) for an application using the hardware performance counters. To compile the perf utility, see Compile performance tools. To calculate IPC, run the following command on the device: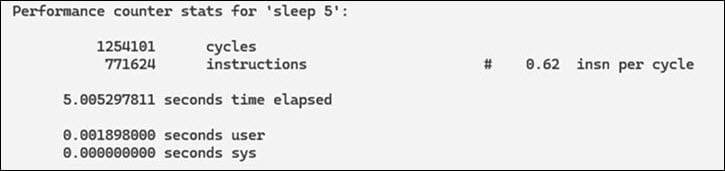
- If the IPC is less than 1.0, it’s likely that the memory is stalled. In this case, Qualcomm Linux tuning strategies, such as reducing the memory I/O workload, can help improve performance.
- If the IPC is greater than 1.0, it’s likely that it’s instruction bound. In this case, reducing code execution by eliminating unnecessary work and cache operations can help improve performance.
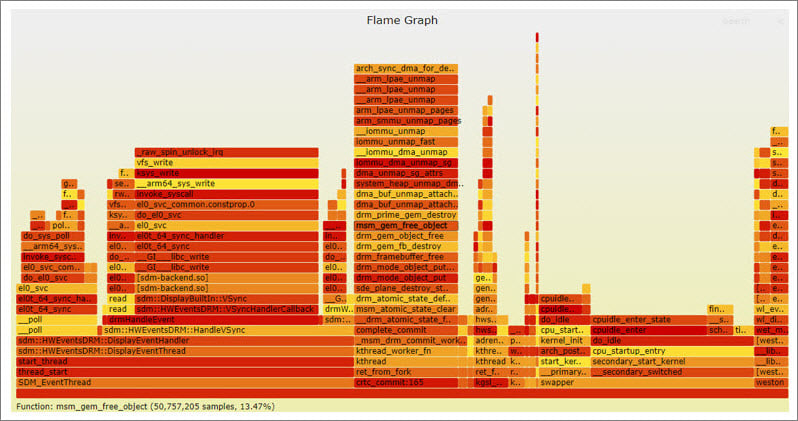
Check parts of code consuming most CPU
The perf utility tool can generate a flame graph that helps visualize the stack and CPU usage of a thread with all the functions running on the CPU. To generate a flame graph, do the following:- On the device:
- Collect logs to generate a flame graph. To collect logs using the perf utility tool, run the following commands:
- Run the following command using SCP or a similar tool and transfer
perf.scriptfrom the target to the host. Ensure that you specify the target IP address in the command. Here is an example command:
- Collect logs to generate a flame graph. To collect logs using the perf utility tool, run the following commands:
- On the host:
- Run the following command to download the flame graph:
Ensure that you install Perl on the host computer. - Copy
perf.scriptin theFlameGraphdirectory: - Open the SVG file in a browser to view the flame graph to know the CPU usage:
- Run the following command to download the flame graph:
Check memory consumed by functions in the user space application code
Valgrind, an open-source tool, provides a utility called massif that helps to analyze the memory consumed by each function in a program. The following is a sample code for memory allocation:…
n3: 20000 (heap allocation functions) malloc/new/new[], —alloc-fns, etc.
n0: 10000 0x10882B: main (in /home/root/valgrind/test)
n2: 8000 0x1087E7: g (in /home/root/valgrind/test)
n1: 4000 0x108807: f (in /home/root/valgrind/test)
n0: 4000 0x10885B: main (in /home/root/valgrind/test)
n0: 4000 0x10885F: main (in /home/root/valgrind/test)
n1: 2000 0x108803: f (in /home/root/valgrind/test)
n0: 2000 0x10885B: main (in /home/root/valgrind/test) For more information about Valgrind, see Valgrind User Manual.
Detect memory leaks in the user space application
To detect memory leaks within a process, you can use the Valgrind tool with the leak‑check feature enabled. The following is a sample code where memory has been allocated but not released:Advanced troubleshooting
Advanced troubleshooting methods are used at the system level. These methods are crucial for building a Qualcomm reference device and integrating Qualcomm Linux across all layers to produce a final product. For related information, see Basic troubleshooting.Boot time
The phases of boot time and boot time log markers help in debugging and optimizing the boot process. The Qualcomm Linux boot chain can be divided into two phases:- Boot loader initialization and kernel loading: The boot loader is initiated and the kernel is loaded.
- Linux system initialization: The kernel, drivers, and user space services are initialized.
First-phase timelines (Boot loader initialization and kernel loading)
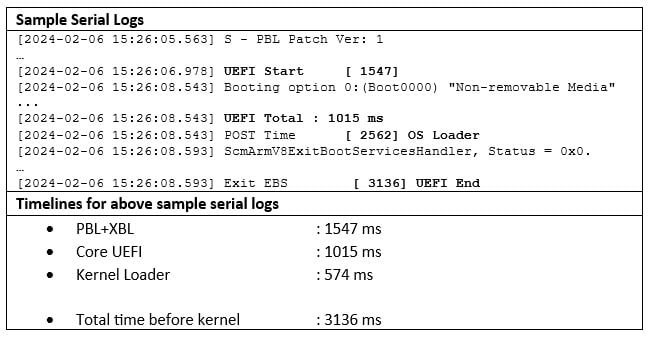
During the device booting sequence, collect the serial logs. Parsing these logs can provide a better understanding of the milestones in this phase. The time taken across the modules can be measured using the respective timestamps listed in the following table:| Module | Debug lines printed |
|---|---|
| PBL + XBL | ”UEFI Start” timestamp |
| Core UEFI | ”UEFI Total” – time consumed is printed in milliseconds |
| Kernel loading | Difference between “UEFI End” - OS Loader” timestamps |
Second phase timelines (Linux system initialization)
To capture performance statistics during system boot, use the systemd-analyze tool. To install the tool, see Analyze performance with tools. To analyze the initialization of drivers within the kernel, enable theinitcall_debug flag in the kernel boot command line. Use the systemd-analyze tool to analyze the initialization details of user space services and applications.
The following are the example commands that you can run on the device for using the systemd-analyze tool:
- To obtain the kernel and user space boot time, run the following command:
The following is an output of the command: Linux QCS6490 (Linux 6.6.0 #1 SMP PREEMPT Sun Feb 4 18:35:47 UTC 2024) arm64. Startup finished in 4.238s (kernel) + 15.620s (userspace) = 19.859s multi-user.target reached after 15.594s in userspace
- To obtain the time consumed by each subsystem during boot, run the following command:
The following is an output of the command: 4.982s android-tools-adbd.service
3.013s dev-disk-byx2dpartlabel-system.device
1.418s systemd-modules-load.service
1.179s sshdgenkeys.service
Graphical view of system initialization time
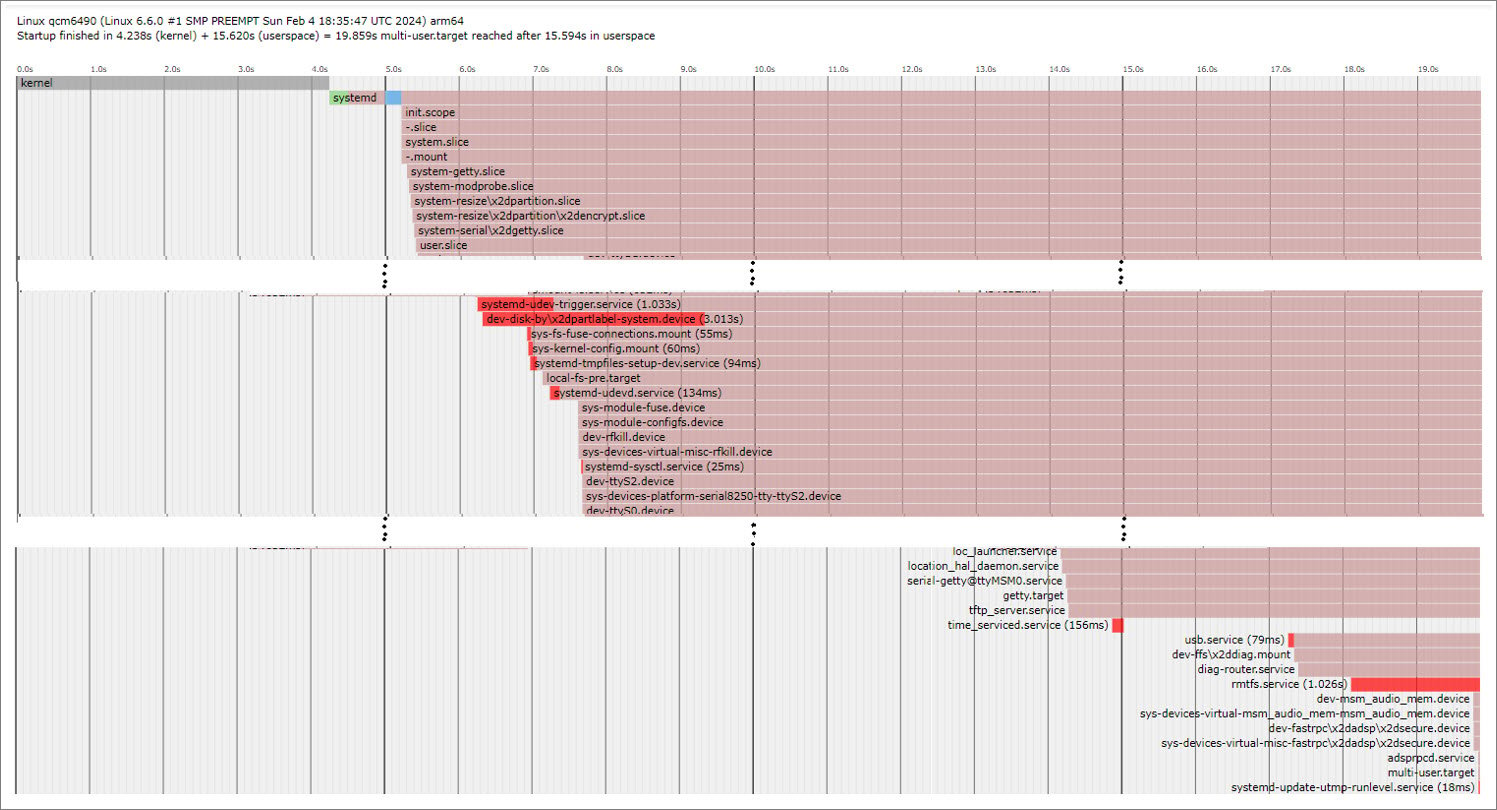
Thesystemd-analyze plot command provides a graphical breakdown of the system services that have started, along with their initialization times.
To obtain a graphical breakdown of the system services, run the following command on the device:
systemd-plot.svg file in any web browser. The following figure shows the example graph:
Identify CPU bound use cases
To verify that a task is running on the most capable CPUs at their maximum frequency, capture the scheduler and frequency ftrace. The following is a sample code that loads the CPU using awhile loop:
Identify I/O bound use cases
To obtain I/O statistics, use/proc/diskstats.
For more information, see /proc/diskstats.
The following is an example of running lmdd on the device for the I/O-bound use case:
- Before running the use case, run the following command:
The following is an output of the command: 8 10 sda10 715 544 15056 250 4394 413 4199944 135729 0 5508 135979 0 0 0 0 0 0 Next, get
pgpginandpgpgoutfrom vmstat:The following is an output of the command: pgpgin 348632pgpgout 2100056 - To run lmdd, you must first compile lmbench, see Compile performance tools for more information. For the I/O-bound use case, run the following lmdd command:
- After running the use case, run the following command:
The following is an output of the command: 8 10 sda10 4822 544 4209448 13018 8530 451 8394624 300094 0 11836 313112 0 0 0 0 0 0
- Next, check
pgpginandpgpgoutagain:The following is an output of the command: pgpgin 2446172pgpgout 4197396
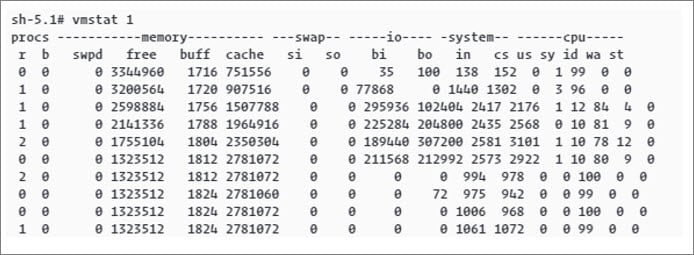
Vmstat
Vmstat is a Linux command used to gather information about block input (bi) and block output (bo). The following figure shows an example of the vmstat output:
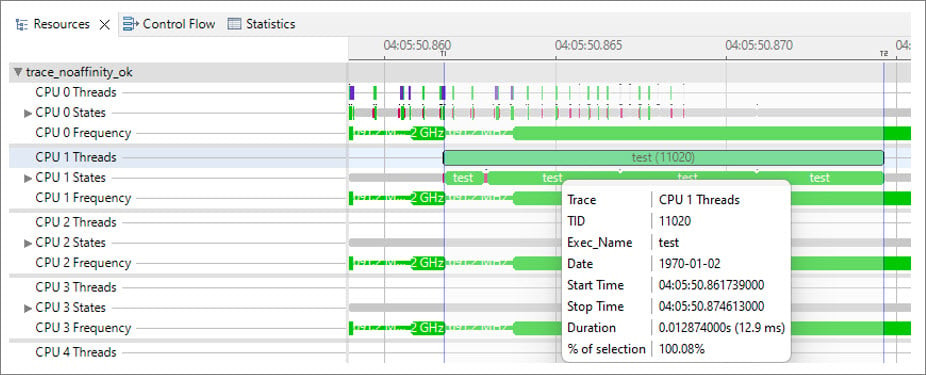
Use large cores for heavy use cases
When a heavy task runs on the Silver core with a high runtime, it can impact performance. Affine such tasks onto the larger (Gold) cores usingsched_setaffinity(). This task affinity can help to reduce the CPU runtime and enhance performance.
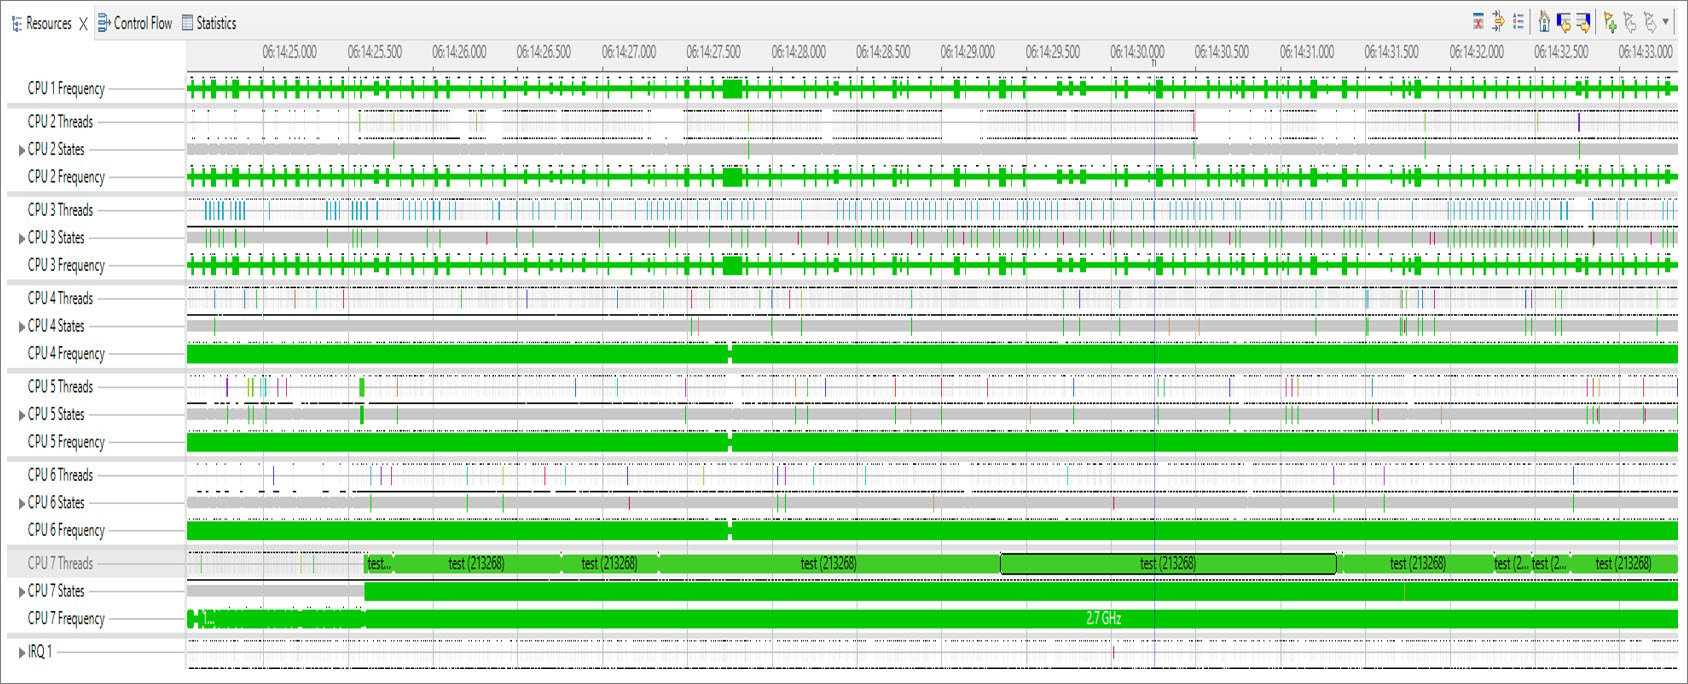
The following figure from Trace Compass shows an example of a thread test running for 12.9 milliseconds on CPU0 at a frequency of 1.9 GHz.
sched_setaffinity(), see sched_setaffinity(2) — Linux manual page.
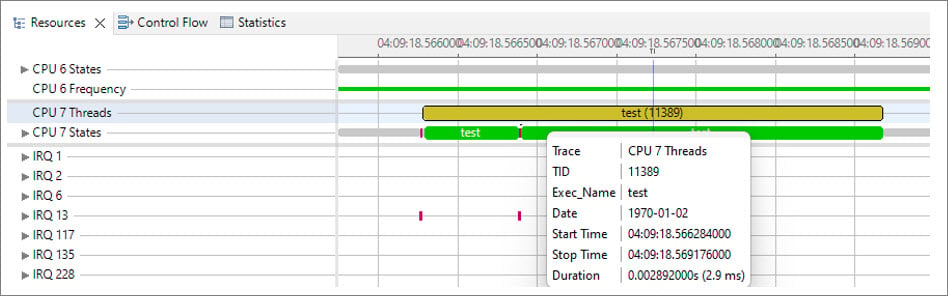
The following is a sample code where a task is affined to Gold core 7:
sched_setaffinity(), it runs on CPU7 and the runtime is reduced from 12.9 milliseconds to 2.9 milliseconds with a CPU frequency of 2.7 GHz.
The following figure shows the reduced time after setting the sched_setaffinity() property:
Mitigate impact of runnables on use cases
When a task is ready to run but the CPU is unavailable, the task is considered to be in a runnable state. This state is assigned to tasks when the CPU is under heavy load. To visualize the status of threads, you can use the Trace Compass Control Flow view. The following figure displays thread statuses represented by different colors:- Dark red line indicates that the thread is in a runnable state
- Yellow lines represent the sleep state
- Red line indicates that the CPU is busy handling
irqorsoftirq
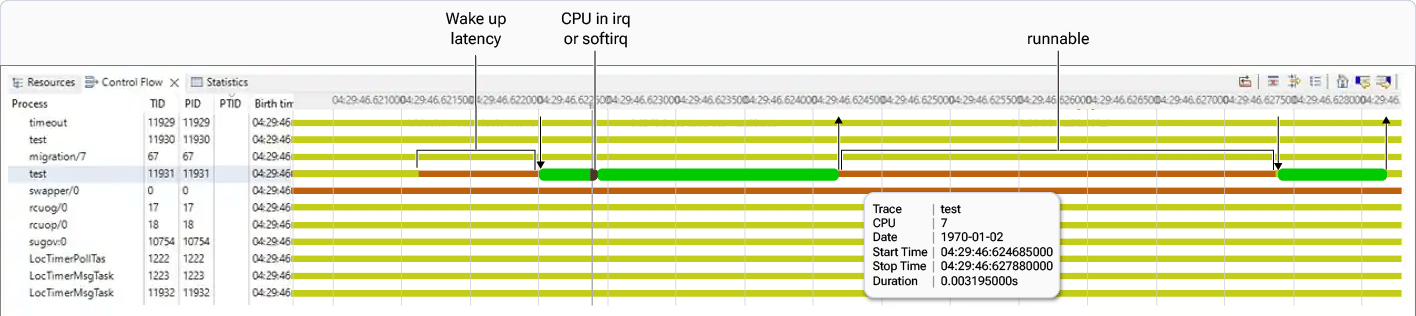
- Wake-up latency runnable refers to the time it takes for tasks that are ready to move from a runnable state to actually running on the CPU. This latency can be reduced by tuning a scheduler or disabling the Low‑power mode of the CPU.
- Normal runnable occurs when the CPU selects the higher-priority processes to run instead of the current one. Increasing the priority of a task can help reduce the runnables.
- The priority of a real-time (RT) thread ranges from 0 to 99, with a higher number indicating a higher priority. To change the real-time thread priority, use the
SCHED_FIFOpolicy insched_setscheduler(). - The priority of a normal thread ranges from 100 to 139, with a lower number indicating a higher priority. To change the normal thread priority, use the
reniceLinux command andsched_setscheduler()with theSCHED_OTHERpolicy. The values in the range –20 to +19 are mapped to the thread priorities in the range 100 to 139.
sched_setscheduler().
For sched_setscheduler(), see sched_setscheduler(2)—Linux manual page.
The following is a sample code that reduces runnable time by changing the thread priority using sched_setscheduler():
SCHED_FIFO is for the RT threads. The sched_priority is equal to 1.
Speed up CPU ramp-up time
A delay in transitioning to a higher required CPU frequency can impact performance. You can tune thesched_util_clamp_min scheduler node to speed up the CPU frequency ramp-up.
Tune the sched_util_clamp_min within a range of 0 to 1024. Higher values can enhance performance but may also increase power consumption.
The following are examples of how the test thread performs on core 4:
- When
sched_util_clamp_minis 0, the CPU frequency ramps up slowly from 691 MHz to 1.5 GHz and then to 1.7 GHz. You can set this value by running the following command on the device:The following figure from Trace Compass shows the ramping up of the CPU frequency:
- When
sched_util_clamp_minis 512, the CPU frequency ramps up directly from 691 MHz to 1.9 GHz. You can set this value by running the following command on the device:The following figure shows the ramping up of the CPU frequency to 1.9 GHz:
- When
sched_util_clamp_minis 1024, the CPU frequency ramps up from 691 MHz directly to the maximum frequency (FMAX) of 2.4 GHz. You can set this value by running the following command on the device:The following figure shows the ramping up of the CPU frequency directly from 691 MHz to FMAX 2.4 GHz: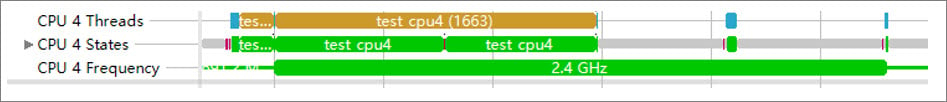
Determine cache residency for use cases
The perf utility tool is used to analyze cache misses and cache refill counter statistics. This analysis helps to determine the residency of a use case in a specific cache, such as L2, L3, and last level cache controller (LLCC) DDR residency. For instructions on how to compile the perf utility, see Compile performance tools. To check the available cache event for the target, run the following command on the device:Identify lock contention
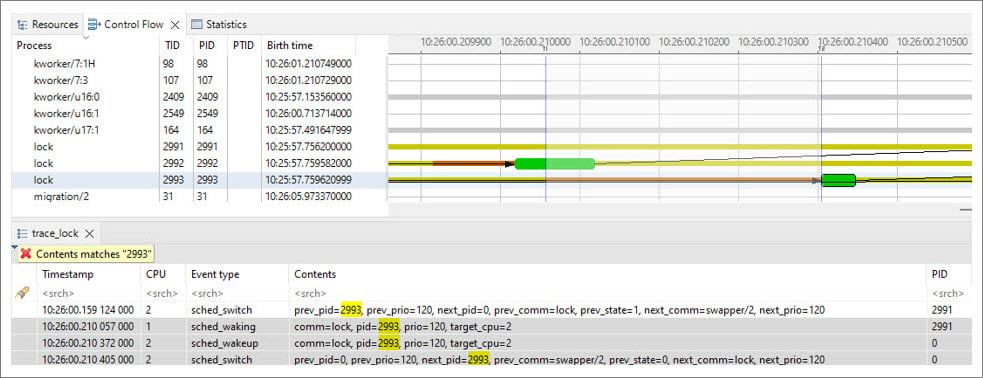
Lock contention occurs when one thread (thread_1) attempts to acquire a Mutex lock that’s already held by another thread (thread_2). In this situation, thread_1 enters the Sleep mode and wakes up when thread_2 releases the Mutex lock. To resolve this issue, go to Trace Compass and select Select Previous State Change as shown in the following figure: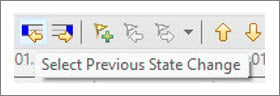
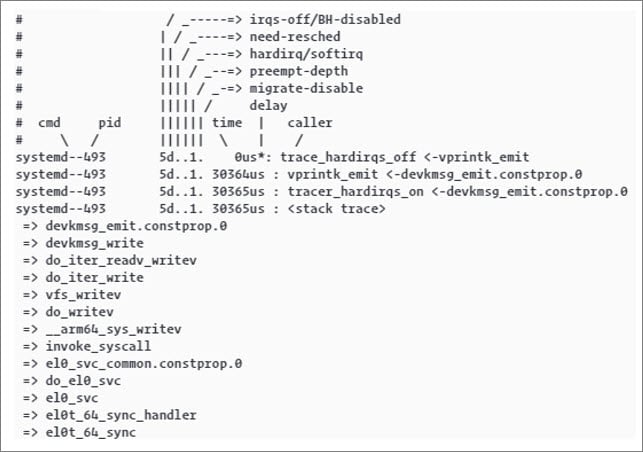
Determine duration of pre-emption disabling
The kernel operates on a pre-emptive basis. This means that any kernel process can be paused at any moment to make way for a higher priority process. Therefore, a new task can start running in the same critical region where a previous task was pre‑empted. The following procedure outlines how to record the duration during which pre-emption is disabled:- From the kernel configuration, enable
CONFIG_IRQSOFF_TRACERandCONFIG_PREEMPT_TRACERin the source code. - To collect a trace, run the following commands: Note The following commands should be run on the device.
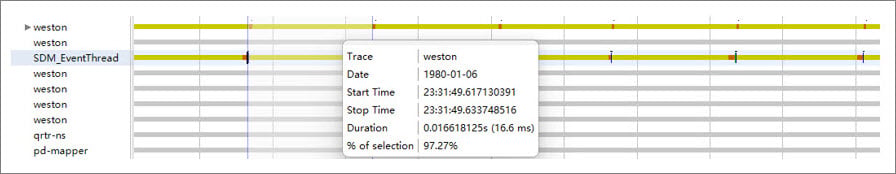
Debug frame drops
Frame drops can occur due to delays in various subsystems, such as the display or camera. For example, if the display refresh rate is 60 Hz, each frame must be completed within 16.6 milliseconds. The following figure shows a trace whereWeston and SDM_EventThread run every 16.6 milliseconds. Any application must render periodically and complete its rendering within this 16.6 milliseconds timeframe. If rendering isn’t complete before this window expires, the frames are dropped.
Identify memory thrashing
Memory thrashing occurs when the system spends a significant amount of time reclaiming memory from RAM and then reloads the same content back into RAM. This can occur on file cache pages from disk and anonymous pages from ZRAM, leading to substantial performance degradation. Memory thrashing typically occurs when the available memory is insufficient for the current use case (referred to as the workingset). This causes the system to struggle in finding memory that can be reclaimed. You can identify memory thrashing from the following information in/proc/vmstat:
| vmstat nodes | Description |
|---|---|
workingset_refault_anon/workingset_refault_file | These nodes represent the number of reclaimed pages that are immediately requested after reclaim. The lower these numbers, the better. |
workingset_activate_anon/workingset_activate_file | These nodes represent the number of reclaimed pages that are immediately activated after reclaim. The lower these numbers, the better. |
pgpgin/pswpin | These nodes represent the number of pages read from swap and swapped back into the RAM memory. |
pgpgout/pswpout | These nodes represent the number of pages written to swap as part of reclaim. If pgpg* and pswp* are increasing simultaneously along with workingset_refaults, it indicates a memory thrashing situation. |
pgsteal_kswapd/pgsteal_direct | These nodes represent the number of pages reclaimed by the system. |
pgscan_kswapd/pgscan_direct | These nodes represent the number of pages that the system has scanned to find reclaimable memory. The ratio of pgsteal/pgscan indicates the reclaim efficiency of the system. A higher value indicates better system performance while a lower reclaim efficiency indicates that the system is struggling to find reclaimable memory, indicative of memory thrashing. |