

Status Bar Actions
The VS Code Status Bar at the bottom of the window contains action buttons added by the extension: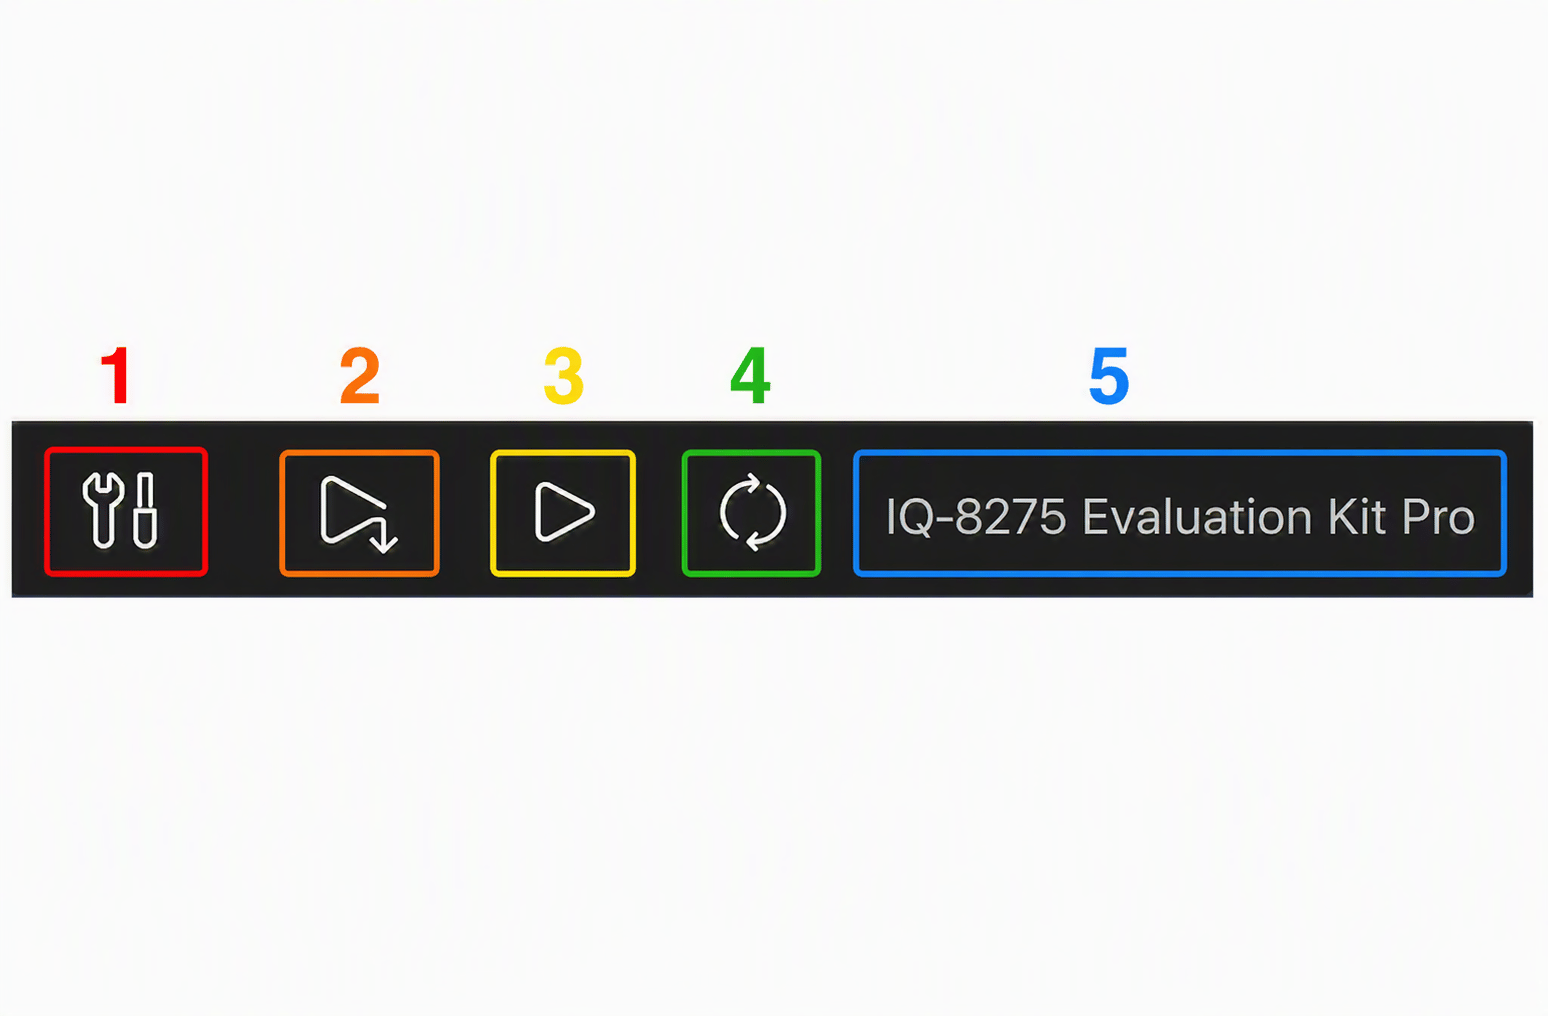
| # | Button | Action |
|---|---|---|
| 1 | Build | Cross-compile the project for the active device |
| 2 | Deploy | Build + push the binary to the device |
| 3 | Run | Execute the deployed binary on the device |
| 4 | Refresh Device | Re-scan for connected devices |
| 5 | Select a Connected Device | Choose which connected device to target |
Build
Click Build (or run theBuild task via Ctrl+Shift+B). The extension uses the SDK toolchain configured by the workspace and compiles the project.
Deploy
Click Deploy. The extension compiles the project (same as Build) and then pushes the binary over ADB or SSH.Run
Click Run to execute the deployed binary on the active device. The extension launches the binary over ADB or SSH and streams its output to the integrated terminal.Debug
Inspect state
The debug panel provides access to: - Variables pane — local and global
variable values - Watch pane — custom expressions - Call Stack —
full call chain from the breakpoint - Registers — hardware register
contents - Disassembly — mixed source + assembly view - Memory — raw
memory inspection
The debug configuration is auto-generated in
.vscode/launch.json. Edit this
file to change the remote target address, binary path, or GDB/LLDB arguments.Troubleshooting builds
IntelliSense showing wrong errors
IntelliSense showing wrong errors
The
.vscode/c_cpp_properties.json file may be stale. Run QVSCE: Regenerate Workspace from the Command Palette (Ctrl+Shift+P) to regenerate it.Binary not found on device after deploy
Binary not found on device after deploy
Verify the active device is correctly set in Dashboard → Devices. Check that ADB/SSH connectivity is working:
Debug session fails to attach
Debug session fails to attach
Ensure the binary was compiled with debug symbols (
-g flag). Verify that gdbserver is installed on the device — run which gdbserver over ADB/SSH to confirm.